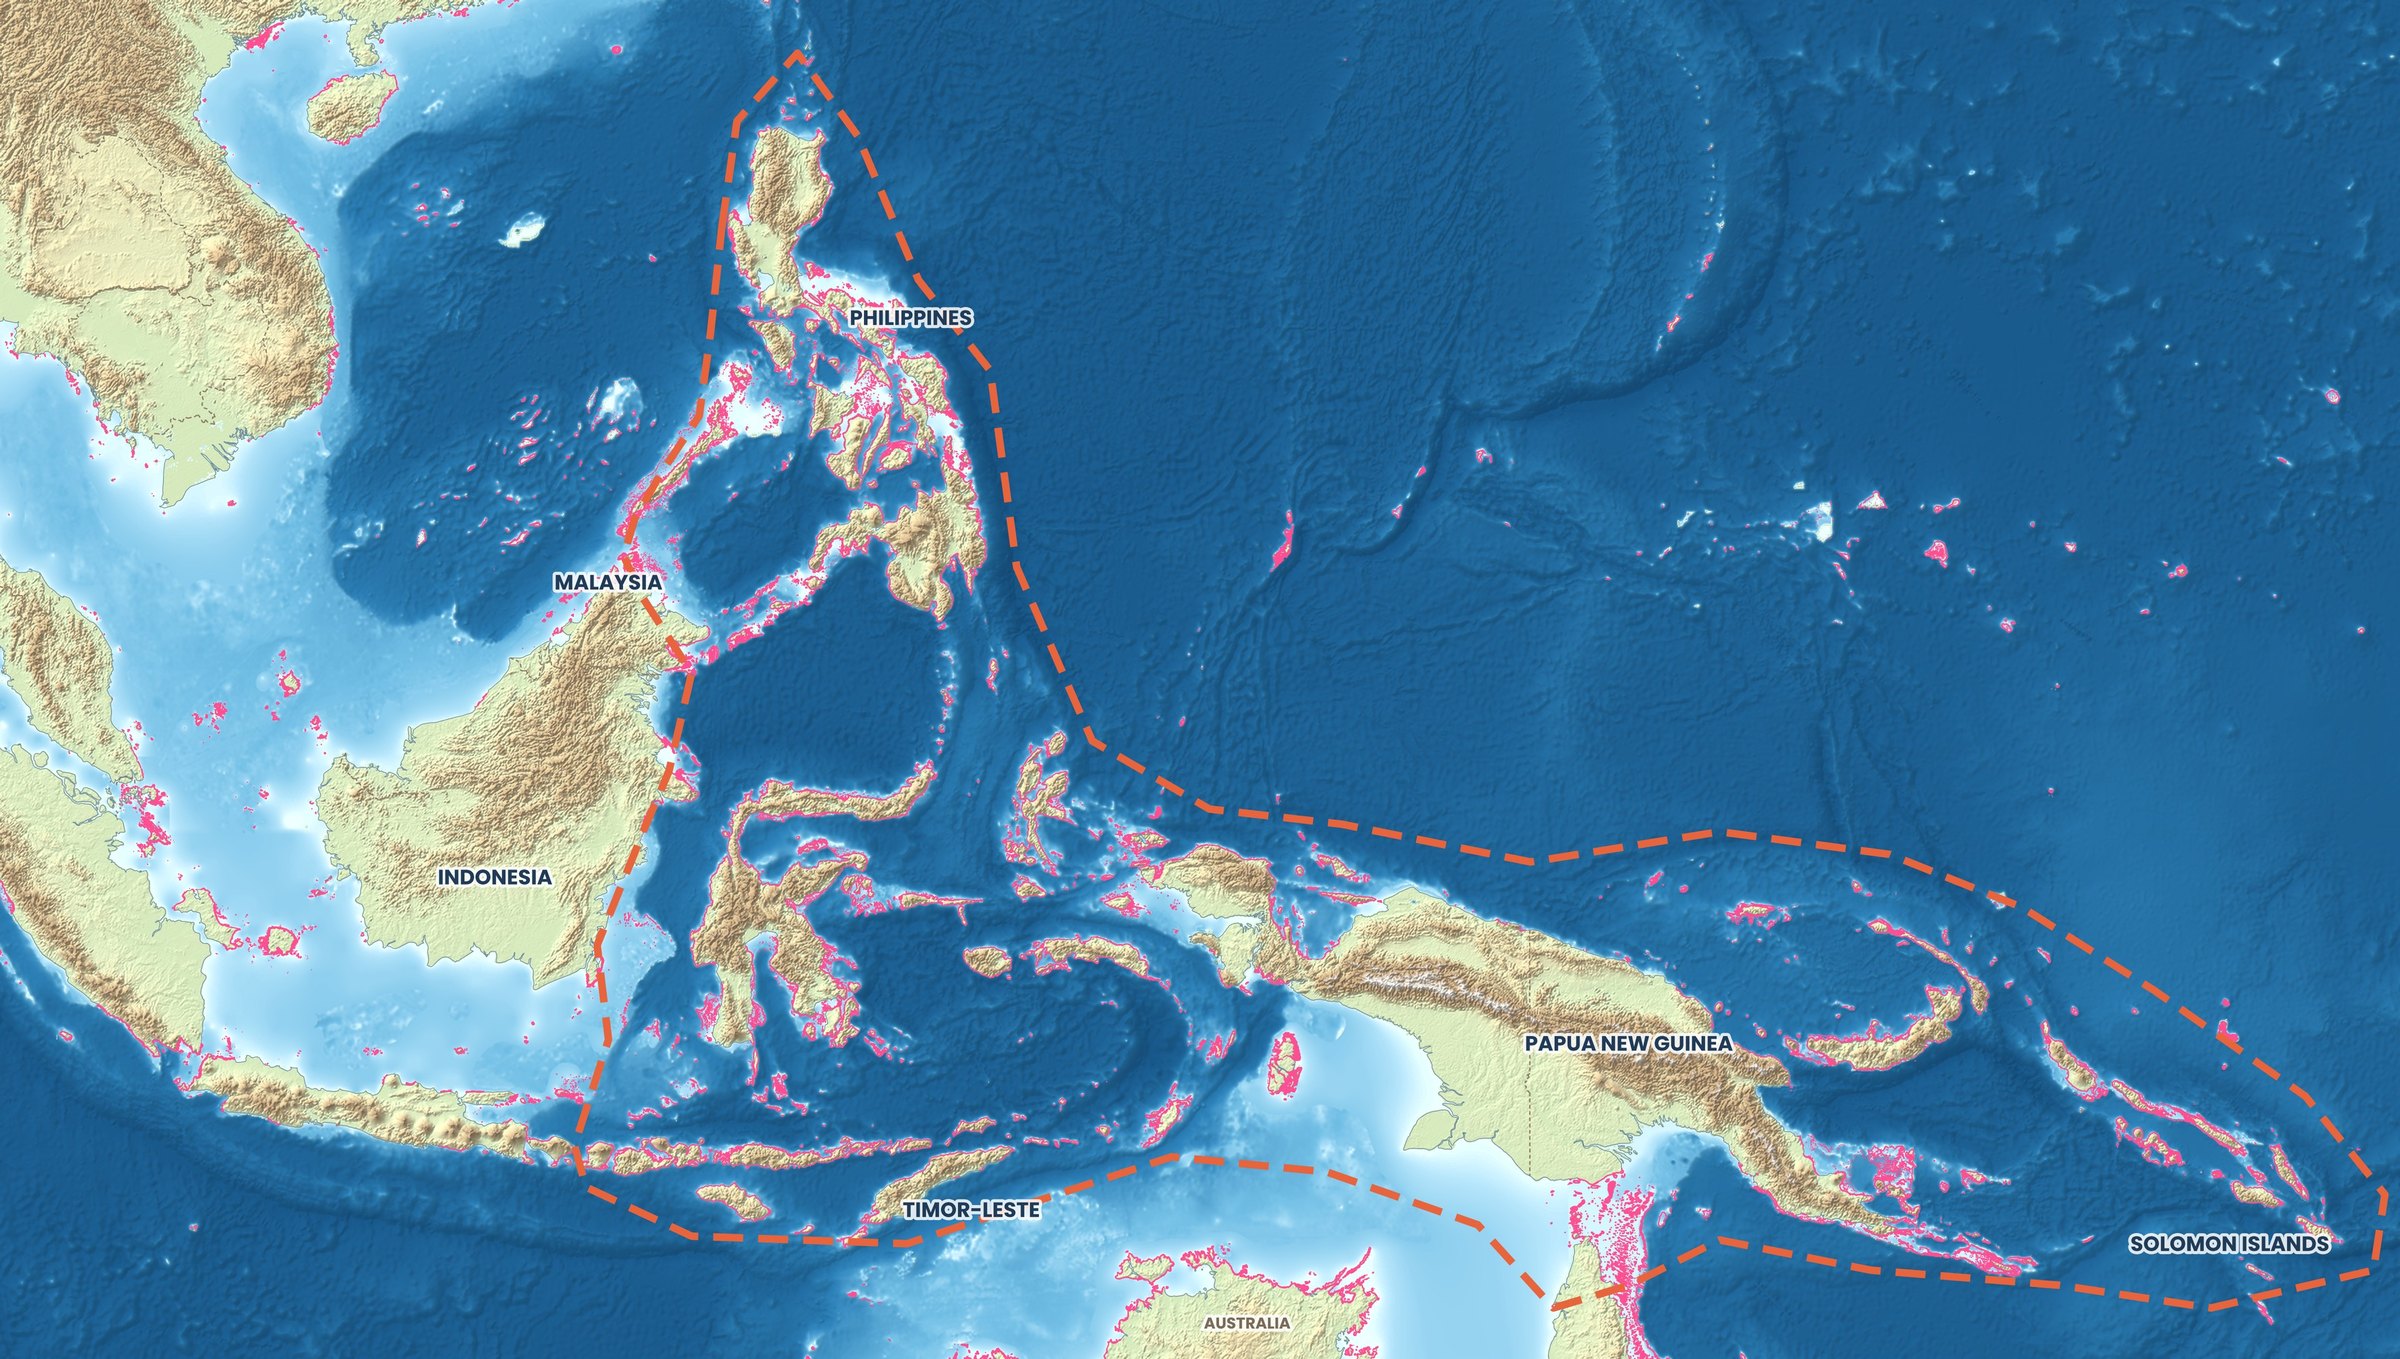
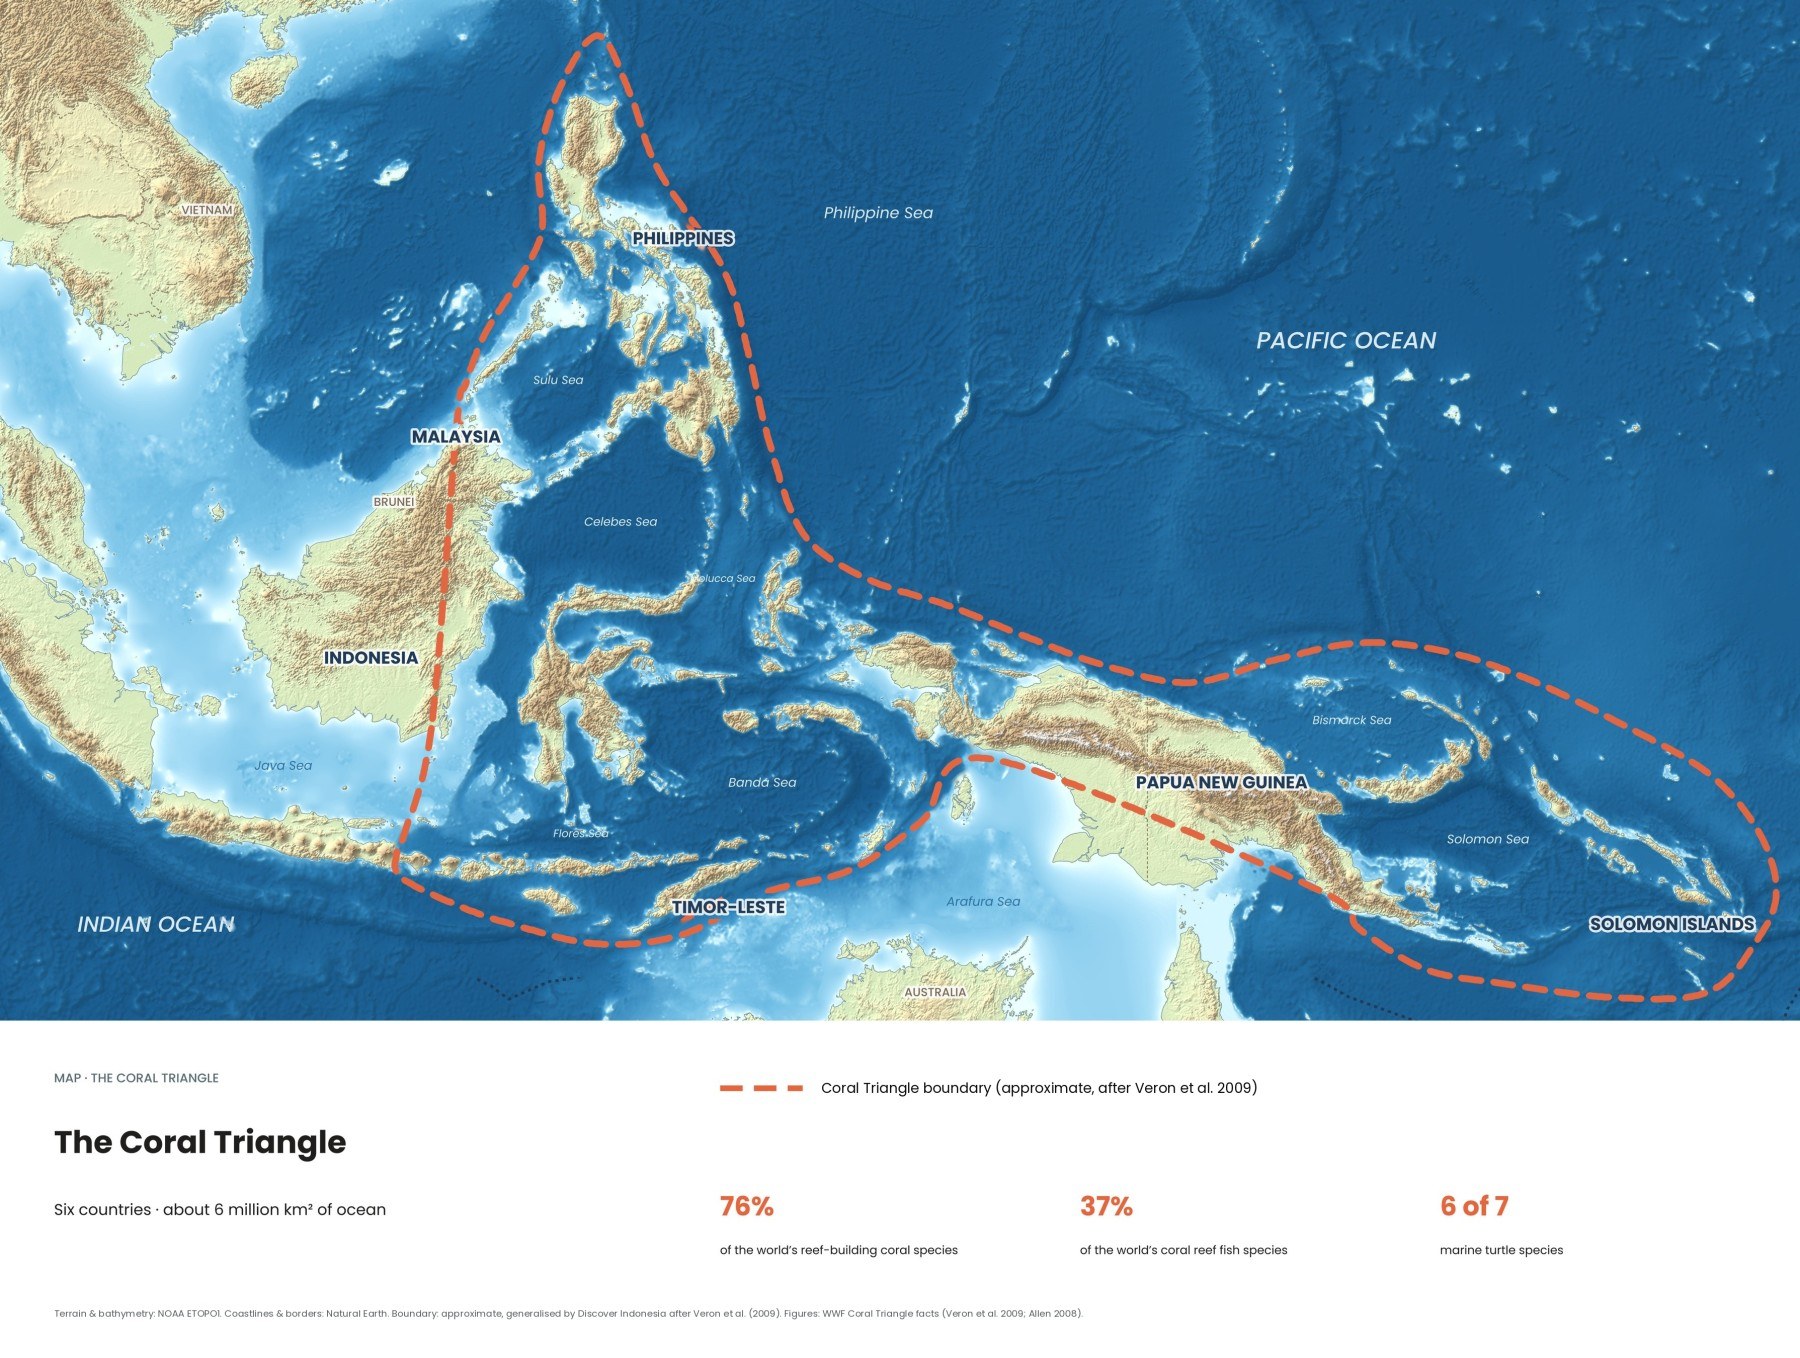
Oil on the sea surface is hard to spot from a boat, but satellite radar sees it clearly. Between August 2020 and October 2026, the Cerulean project by SkyTruth detected 23,036 likely oil slicks in the waters around the Coral Triangle, 12,883 of them inside its boundary. Most were not dramatic spills but routine dumping from ships.
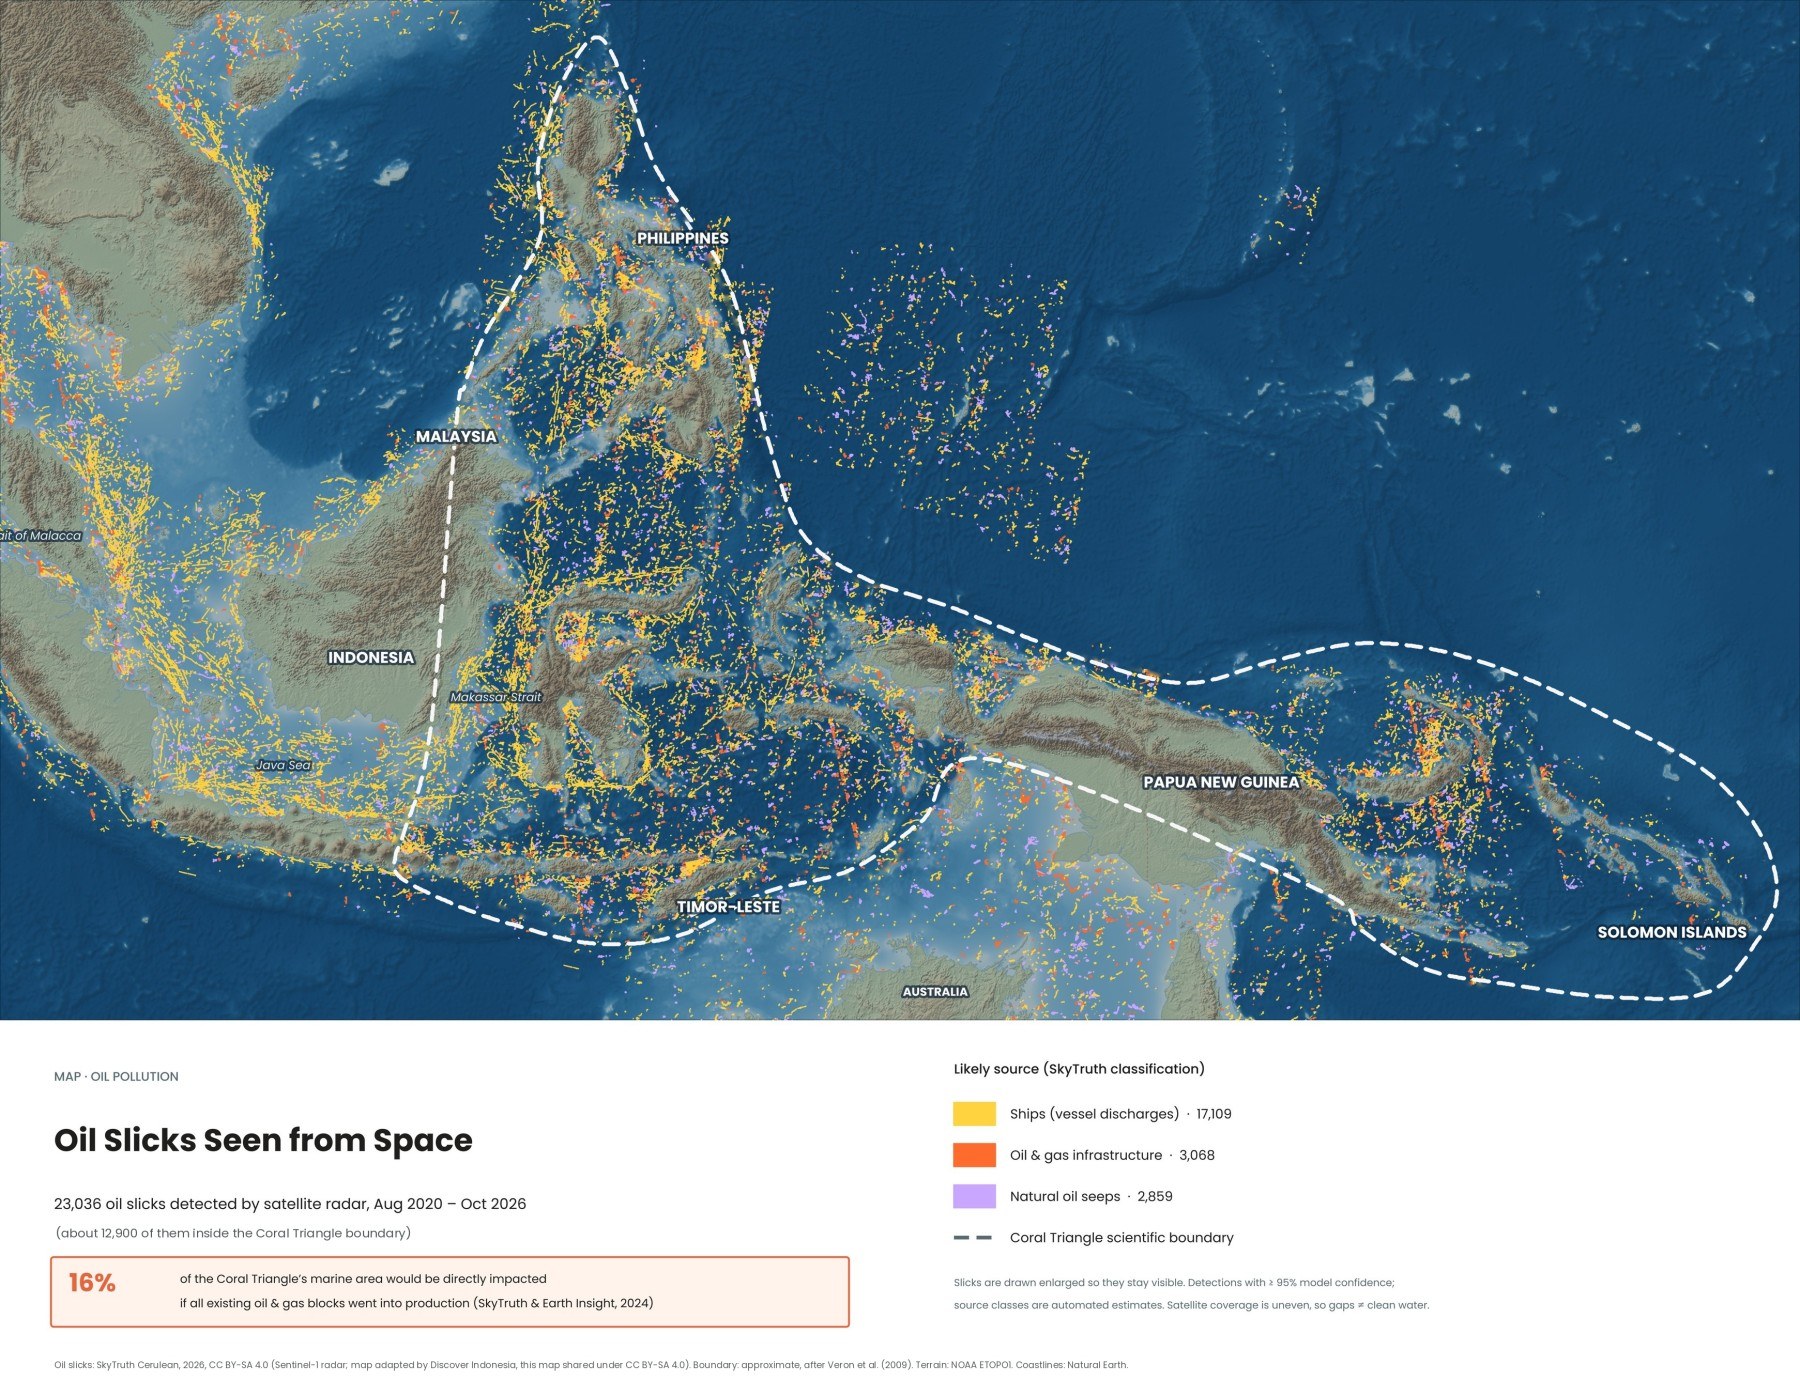
When people think of oil pollution they picture a tanker on the rocks. In the seas around Indonesia the bigger story is quieter: thousands of thin streaks of oil left by passing ships, most never reported, cleaned up or traced. The map above shows six years of them.
How can satellites see oil on the sea?
Radar satellites see oil because it calms the water. The European Sentinel-1 satellites send radar pulses down to the sea, and small wind ripples scatter part of the signal back. An oil film damps those ripples, so a slick shows up as a dark streak. Radar works at night and through cloud, and SkyTruth's Cerulean system runs each scene through a machine-learning model trained on slicks labelled by experts, usually within 6 to 12 hours of a satellite pass.
The method has limits. Calm water, wind shadows behind islands and some natural surface films also look dark, so SkyTruth calls every detection a "potential" slick. Our map uses only detections rated at 95 percent confidence or higher, which removes many false alarms but not all. Counts also depend on the filters: a 2024 Earth Insight and SkyTruth report, using a narrower selection, cited 793 slicks around the Coral Triangle since 2020. Coverage is uneven, so treat the map as a picture of patterns, not a precise census.
Where do the oil slicks in the Coral Triangle come from?
Mostly from ships. Of the 23,036 slicks in our map, Cerulean linked 17,109 to vessels, 3,068 to oil and gas infrastructure such as platforms and pipelines, and 2,859 to natural seeps. Those source classes are automated estimates, not court findings.
| Likely source | Slicks | What it usually means |
|---|---|---|
| Ships | 17,109 | Long, straight slicks behind moving vessels, most likely oily waste discharged at sea |
| Oil & gas infrastructure | 3,068 | Slicks starting at platforms, wells or pipelines |
| Natural seeps | 2,859 | Oil escaping naturally from the seabed, often in the same place again and again |
To link a slick to a ship, Cerulean compares long, linear slicks with ship tracking (AIS) data from 8 hours before to 6 hours after the image, and checks for large "dark" vessels on the radar within 50 kilometres for ships that switch their transponders off. For platforms it uses a monthly updated map of offshore structures from Global Fishing Watch.
Most of the ship oil is dumping, not spills. Engine rooms produce bilge water, a mix of seawater, fuel, oil and cleaning fluids. Under the MARPOL convention it may only be discharged after an oily water separator has cleaned it to below 15 parts per million of oil, but treating waste costs time and money, so some crews pump it overboard untreated far from shore. SkyTruth estimated that ships may dump more than 1.8 million barrels of oil a year worldwide.
Which shipping lanes carry the most oil pollution?
The densest lines on the map follow the busiest shipping routes: the Strait of Malacca, the Java Sea and the Makassar Strait, the arteries that connect the Indian Ocean with East Asia. The Strait of Malacca runs for about 900 kilometres between Sumatra and the Malay Peninsula and carries roughly a quarter of the world's traded goods and, as of 2024, over a third of seaborne oil. Its shallowest point in the Singapore Strait is about 25 metres, which limits the size of ships that can use it.
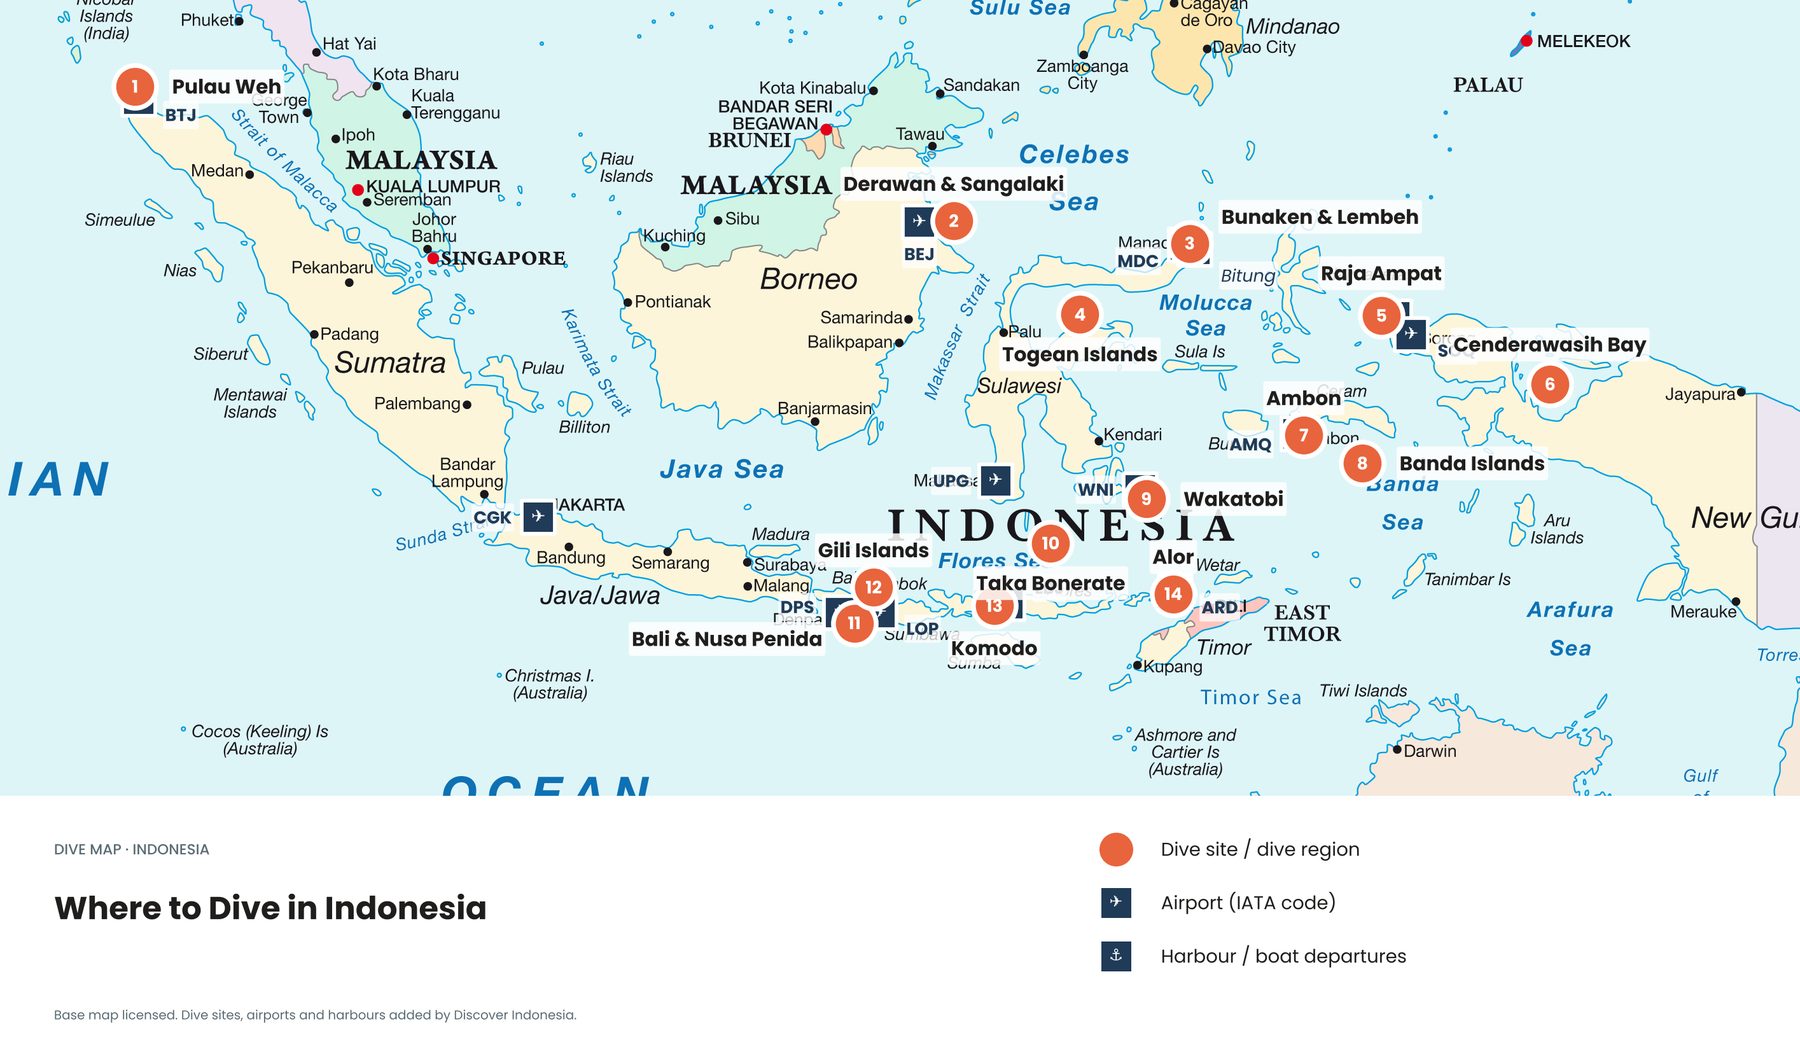
Ships too deep for Malacca, including the largest crude carriers, detour through the Lombok Strait between Bali and Lombok, at least 250 metres deep and about 20 kilometres wide at its narrowest, then north through the Makassar Strait past the oil and coal ports of Balikpapan and Bontang. That matters for divers: the Lombok Strait runs right past the reefs of Nusa Penida, and it is a main channel of the Indonesian Throughflow. See the reefs on our Bali dive map.
Have there been major oil spills in Indonesia and the Coral Triangle?
Yes, several. Big spills are rarer than routine dumping, but they can do concentrated damage to a single coastline, especially where mangroves trap the oil.
- Strait of Malacca, 1975 to 1993. The tankers Showa Maru, Nagasaki Spirit and Maersk Navigator spilled between about 4,000 and 25,000 tonnes each, threatening the Sumatran coast.
- Cilacap, Java, 2004. The tanker Lucky Lady ran aground and released about 1,200 tonnes of crude, oiling beaches and mangroves.
- Montara, Timor Sea, 2009. A well blowout off northern Australia leaked oil for 75 days. In 2016 a class action was filed on behalf of more than 13,000 Indonesian seaweed farmers.
- Balikpapan Bay, East Kalimantan, 2018. A ruptured Pertamina pipeline spread oil across about 200 square kilometres on 31 March 2018. The oil caught fire, five residents died, and at least 34 hectares of mangroves were oiled.
- Philippines, 2023. The tanker Princess Empress sank with 800,000 litres of industrial fuel oil, affecting 20 marine protected areas.
What about oil and gas platforms?
They are the second-largest source on the map and the biggest future risk. In 2024, Earth Insight and SkyTruth found more than 100 offshore blocks in production across the region and more than 450 more earmarked for exploration. If all were approved, they would cover 16 percent of the Coral Triangle, an area the size of Indonesia. The report found that 16 percent of marine protected areas and 11 percent of key biodiversity areas overlap with oil and gas operations, and within those zones 24 percent of coral reefs, 22 percent of seagrass meadows and 37 percent of mangroves overlap with current or planned blocks. The authors called for a moratorium on new fossil fuel development in ecologically sensitive areas.
Natural seeps are a different case. Oil has leaked from the seabed in some places for a very long time, and marine life there has partly adapted. They are on the map because radar cannot tell natural oil from spilled oil.
How does oil harm coral reefs, mangroves and wildlife?
Oil floats, so it does the most harm where the sea surface meets something living: mangrove shores, seagrass flats, shallow reef tops at low tide, and animals that come up to breathe or feed.
- Mangroves rank among the most sensitive habitats. Oil coats the aerial roots the trees use to breathe, and many clean-up methods damage them further.
- Seagrass and reef flats are exposed when oil drifts into sheltered, shallow water.
- Corals can be harmed by toxic compounds dissolved from oil, and by some chemical dispersants.
- Seabirds, turtles, dugongs and dolphins come into direct contact with slicks when they surface; most oiled birds die without care.
Chronic small slicks are harder to study than a single spill, but their effects add up along busy straits that run beside reefs and mangrove coasts. Our map of reefs, seagrass and mangroves shows how many of these habitats line the shipping routes.
Who monitors oil pollution in Indonesia?
Indonesia's Directorate General of Sea Transportation, part of the Ministry of Transportation, leads oil spill preparedness and response under a National Oil Spill Contingency Plan approved in 2006. Indonesia, Malaysia and Singapore have a joint procedure for the Straits of Malacca, and Indonesia and Malaysia share a plan covering the Lombok and Makassar straits and the Sulawesi Sea. Cerulean is free for enforcement agencies, journalists and conservation groups, and can point to the likely ship behind a slick within hours, though a fine still needs port inspections and national action.
Quick answers
Is most oil pollution in Indonesia from spills?
No. Most slicks on the map are linked to ships and are most likely routine discharges of oily waste, small one by one but continuous.
Why do the biggest tankers use the Lombok Strait?
Because they are too deep for the Strait of Malacca, whose shallowest point is about 25 metres. The Lombok Strait is at least 250 metres deep.
What should I do if I see an oil slick?
Note the time, place and any nearby ship, take photos, and tell your dive operator or the local marine park office. Tar balls on a beach and oiled wildlife are worth reporting too.
Supporting protected areas that cover whole coastlines gives these habitats the best chance to recover: see our map of marine protected areas in the Coral Triangle. Our Discover Indonesia Coral Triangle and diving guides go deeper. Browse all our guides, or see all eight Coral Triangle maps →
Facts checked October 2026. Cerulean detections and source attributions are automated and updated continuously; check the live Cerulean map and SkyTruth's methods page for the latest data, and ITOPF or the Indonesian Ministry of Transportation for spill response.
- What is Cerulean? (SkyTruth). Map data: Cerulean detections with at least 95% model confidence, 2020–2026, CC BY-SA 4.0
- Cerulean methods (SkyTruth)
- Leveling up Cerulean's ability to reveal stationary polluters (SkyTruth, 2025)
- Coral Triangle threats and impacts (SkyTruth)
- Coral biodiversity hotspot at risk from fossil fuel expansion, report warns (Mongabay, 2024)
- Indonesia country profile (ITOPF)
- Oil spills in mangroves (NOAA Office of Response and Restoration)
- Strait of Malacca (Wikipedia)
- Lombok Strait (Wikipedia)
- Montara oil spill (Wikipedia)
- 2018 Balikpapan oil spill (Wikipedia)
- Oily water separator (marine) (Wikipedia)
- Boundary: approximate, generalised by Discover Indonesia after Veron et al. (2009). Terrain: NOAA ETOPO1. Coastlines: Natural Earth